- Scan competitors and news for agent trends (security, observability, standards).
- Align with our audience: founders, e‑commerce operators, tech leads.
- Identify a gap: practical, vendor‑agnostic agent observability + KPIs.
- Do light SEO: primary keyword “AI agent observability.”
- Draft a step‑by‑step blueprint with tools, code tips, SLOs, and internal links.
The 2025 Agent Observability Blueprint: Instrument AI Agents with OpenTelemetry and Business KPIs
Agent adoption is accelerating, but so are risks and costs. Good news: observability for agents matured fast in 2025. OpenTelemetry released Generative AI semantic conventions and is actively defining agent spans; Datadog, Azure Monitor, and open‑source stacks like Phoenix and OpenLLMetry now capture traces, tokens, costs, and tool calls end‑to‑end. citeturn1search1turn1search4turn3search4turn4search0turn1search5turn2search5
At the same time, researchers and executives warn about agent impersonation and abuse—making runtime visibility and guardrails non‑negotiable. citeturn0news13turn0news12
Who this guide is for
• Startup founders shipping agent features. • E‑commerce teams adding agents to checkout recovery and support. • Tech leads accountable for SLAs, costs, and compliance.
If you’re deploying voice or web‑acting agents, pair this guide with our security and eval playbooks:
Agent Impersonation: Security Checklist,
Agent Evaluation Lab in 7 Days, and
Voice AI Agents in 10 Days.
What to measure: the Agent KPI set
- Time to first token (TTFT), end‑to‑end latency, and tool latency.
- Action success rate (tool/API call success), retry rate, and fallback rate.
- Guardrail violations (schema, safety filters) and blocked actions.
- Memory hit rate and TTL violations (see our Memory Playbook).
- Cost per task/session, tokens per successful task, cache hit rate.
- Business conversion (lead, order, recovery) and CSAT where applicable.
OpenTelemetry’s GenAI metrics include token usage and time‑per‑token; vendor platforms add cost and tool graphs on top. citeturn1search1turn3search0
Reference architecture: vendor‑neutral on top of OpenTelemetry
- Emit OpenTelemetry (OTel) traces from your agent planner, model calls, memory reads/writes, and tool invocations.
- Pick a backend:
- Open‑source: Arize Phoenix (OTel‑native LLM/agent tracing, evals) or OpenLLMetry (OTel extensions + SDK). citeturn1search5turn2search5
- Managed: LangSmith (agent tracing + OTel support), Datadog LLM Observability, or Azure Monitor Agents. citeturn2search1turn3search4turn4search0
- Add evaluations (offline and online) for quality, safety, and task success—see our 7‑day eval lab.
- Wire guardrails and log policy events (don’t store secrets or chain‑of‑thought).
- Publish dashboards and SLOs (below), then alert on burn rate and outliers.
Quick start: instrument an agent with OTel
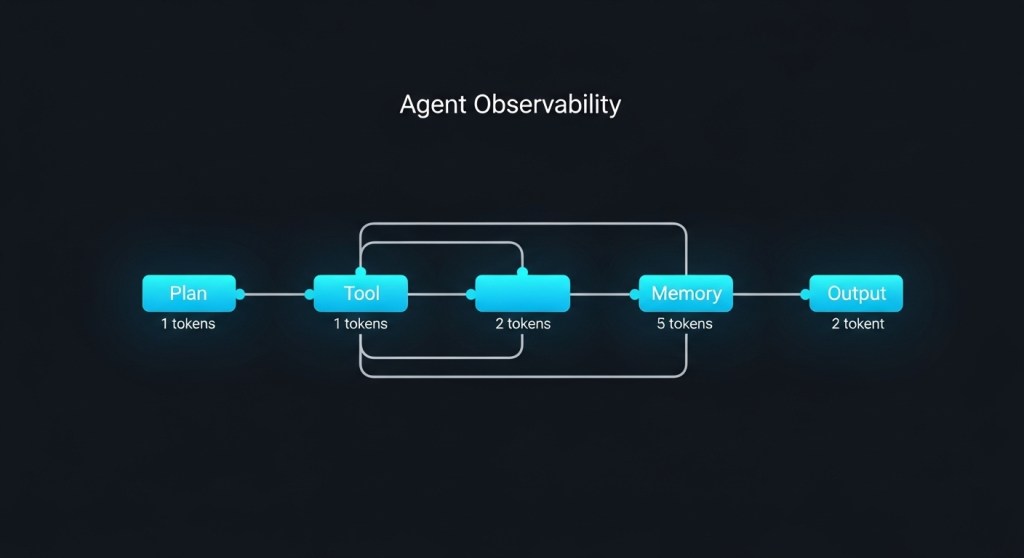
The exact code depends on your framework, but the pattern is consistent: emit a trace span for each step (plan → tool call → memory → model) and tag it with model, version, prompt hash, tokens, and cost.
# Python, conceptual example
from opentelemetry import trace
from opentelemetry.sdk.trace import TracerProvider
from opentelemetry.sdk.trace.export import BatchSpanProcessor
from opentelemetry.exporter.otlp.proto.grpc.trace_exporter import OTLPSpanExporter

trace.set_tracer_provider(TracerProvider())
trace.get_tracer_provider().add_span_processor(
    BatchSpanProcessor(OTLPSpanExporter(endpoint="https://otel-collector:4317"))
)

tracer = trace.get_tracer("checkout-recovery-agent")

with tracer.start_as_current_span("plan") as s:
    s.set_attribute("gen_ai.model", "gpt-4o-mini")
    s.set_attribute("gen_ai.prompt_hash", "abc123")
    # ... plan steps

with tracer.start_as_current_span("tool:send-email") as s:
    s.set_attribute("tool.name", "send_email")
    s.set_attribute("tool.success", True)

with tracer.start_as_current_span("llm:respond") as s:
    s.set_attribute("gen_ai.input_tokens", 256)
    s.set_attribute("gen_ai.output_tokens", 142)
    s.set_attribute("cost.usd", 0.0034)
OTel GenAI conventions standardize token metrics and attributes so you can switch backends without re‑instrumentation. citeturn1search1
Framework‑specific pointers
- LangChain/LangGraph: enable LangSmith tracing and/or OTel export. Docs include one‑env‑var setup and quickstart. citeturn2search2turn2search3
- Open‑source stack: Phoenix supports OTel out‑of‑the‑box; OpenLLMetry adds provider and vector‑DB instrumentations. citeturn1search2turn2search5
- Azure/Microsoft Agent Framework: tutorials show enabling OTel spans and viewing an Agents (Preview) blade in Application Insights. citeturn4search3turn4search0
Dashboards that matter (starter widgets)
- Reliability: action success %, guardrail violation rate, JSON‑schema parse errors, retry/fallback rate.
- Latency: TTFT, model time per token, tool latency, end‑to‑end p50/p95.
- Cost: cost per task/session, tokens per success, cache hit rate, vendor routing mix.
- Quality: eval scores by task type, hallucination flags, user feedback.
- Business: conversions (orders, leads), A/B lift vs. control.
Datadog’s Agent Console and Azure’s Agents view visualize agent decision paths, tools, and token/cost hotspots; Phoenix does similar via open‑source. citeturn3search0turn4search0turn1search5
Define Agent SLOs and alerts
- Reliability SLO: action success ≥ 98% (7‑day rolling). Alert on 2% burn within 1 hour.
- Latency SLO: p95 end‑to‑end ≤ 6s; TTFT ≤ 800ms.
- Quality SLO: online eval score ≥ 0.8; hallucination rate ≤ 1%.
- Cost SLO: cost per successful task ≤ $0.015 (checkout recovery), ≤ $0.005 (support deflection).
Use OTel metrics (token usage, time‑per‑token) and platform cost tracking to compute SLO compliance. citeturn1search1turn3search4
Guardrails and evidence logging (compliance‑ready)
Log policy events (prompt‑injection flagged, PII mask applied, action blocked) as span attributes or events—without persisting sensitive content or chain‑of‑thought. Map these logs to controls in your audit trail; see our
2025 compliance checklist. For multi‑agent deployments, consider sentinel/coordinator patterns from recent research to monitor inter‑agent risks. citeturn4academia13
Tool picker (fast lane)
- Lean, open‑source: OTel + Phoenix or OpenLLMetry; optional Helicone/OTel gateway for quick logs and cost. citeturn1search5turn2search5turn2search6
- Framework‑native: LangSmith if you already run LangChain/LangGraph. citeturn2search1
- Enterprise suite: Datadog or Azure Monitor if you want centralized ops and security workflows. citeturn3search4turn4search0
7‑day rollout plan
- Day 1: Inventory agent flows (web, voice, back office). Choose backend.
- Day 2: Add OTel spans to plan/tool/memory/model steps. Emit token + cost attributes.
- Day 3: Stand up dashboards (Reliability, Latency, Cost, Business).
- Day 4: Wire online evals for key tasks; alert on SLO burn.
- Day 5: Add guardrails and evidence logging (policy events).
- Day 6: Run a game day: inject failures and measure detection MTTR.
- Day 7: Review SLOs, set budgets, and ship an on‑call runbook.
Common pitfalls (and fixes)
- Only tracing the LLM call. Fix: trace planner, tools, memory, and external APIs.
- Storing sensitive prompts/verbatim rationales. Fix: redact or hash; log policy events instead.
- No cost budgets. Fix: alert on cost per task/session; route to cached/cheaper models when safe.
- Ignoring multi‑agent behavior. Fix: visualize cross‑agent graphs; consider sentinel monitoring. citeturn4academia13
Going further
If you’re connecting multiple agent platforms, see our interoperability guide on A2A/MCP and avoid “agent islands.” Read the playbook.
Call to action: Want a pre‑built OTel starter, dashboards, and SLO templates for your stack? Subscribe to HireNinja or contact us to get the Agent Observability Starter for your environment.

Leave a comment